Blog > Housing Report > Southeast Michigan > Southeast Michigan 7-Year Sale Index
Southeast Michigan 7-Year Sale Index

Topics
- Housing Reports
Subscribe
Get the latest Michigan Housing Reports delivered straight to your inbox!
Topics
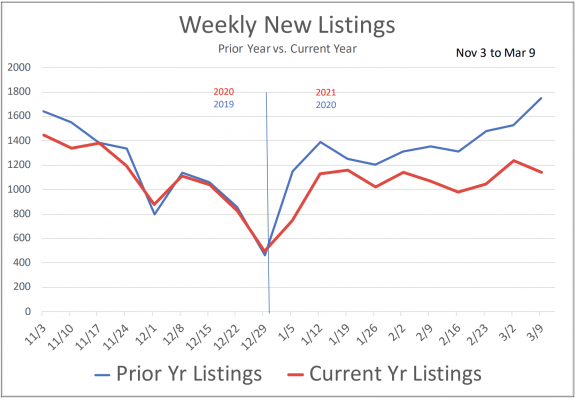
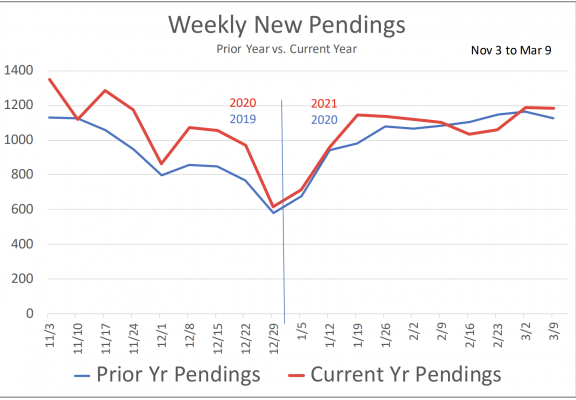
Strong buyer demand is being tested by a lack of inventory. Despite a 60% YOY decline in available listings, closed sales are up by 3% (through March 9th). With rising values and fewer entry-priced sales in the mix, average sale price is up 14%. Both YTD new pendings and closed sales are up by 3%, but new listings have been slow to arrive. The growing inventory shortage is stifling sales. Closed sales, which were up 8% YOY in January, were up by just 1% in February. Buyer competition continues to lift values. YOY monthly price per square foot was up by 11% in January and 15% in February.
| 2019 | 2020 | 2021 | +/- | |
| YTD Units | 7,840 | 8,323 | 8,560 | 3% |
| YTD Vol (million) | $1,642.8 | $1,825.6 | $2,143.3 | 17% |
| Avg Price | $209,545 | $219,339 | $250,385 | 14% |
| Avg $/SF | $130 | $133 | $152 | 14% |
| Avg SF | 1,616 | 1,644 | 1,651 | 0% |


Michigan Property Taxes in a Nutshell
2 minutes
Deprecated: preg_split(): Passing null to parameter #2 ($subject) of type string is deprecated in /usr/share/wordpress/blog/reo_blog/wp-includes/formatting.php on line 3506
After several years of rapidly rising prices and mild inflation (until the past two years) homebuyers and sellers need to be aware of the potential for a significant jump between [...]
Southeast Michigan 2024 Housing: Trends and Predictions
2 minutes
Deprecated: preg_split(): Passing null to parameter #2 ($subject) of type string is deprecated in /usr/share/wordpress/blog/reo_blog/wp-includes/formatting.php on line 3506
Through the first half of 2024, expect demand to continue to outweigh supply. However, as the year progresses, expect to see inventory gradually rise into a more balanced position as [...]
’23 Market Summary and ’24 Predictions
< 1 minute
Deprecated: preg_split(): Passing null to parameter #2 ($subject) of type string is deprecated in /usr/share/wordpress/blog/reo_blog/wp-includes/formatting.php on line 3506
After a few years of supply shortages, inventory began to return to more normal levels in the second half of 2023. Demand remains strong and buyers continue to wait for [...]