Blog > Housing Report > Southeast Michigan > December 2020 Special Report
December 2020 Special Report

Topics
- Housing Reports
Subscribe
Get the latest Michigan Housing Reports delivered straight to your inbox!
Topics
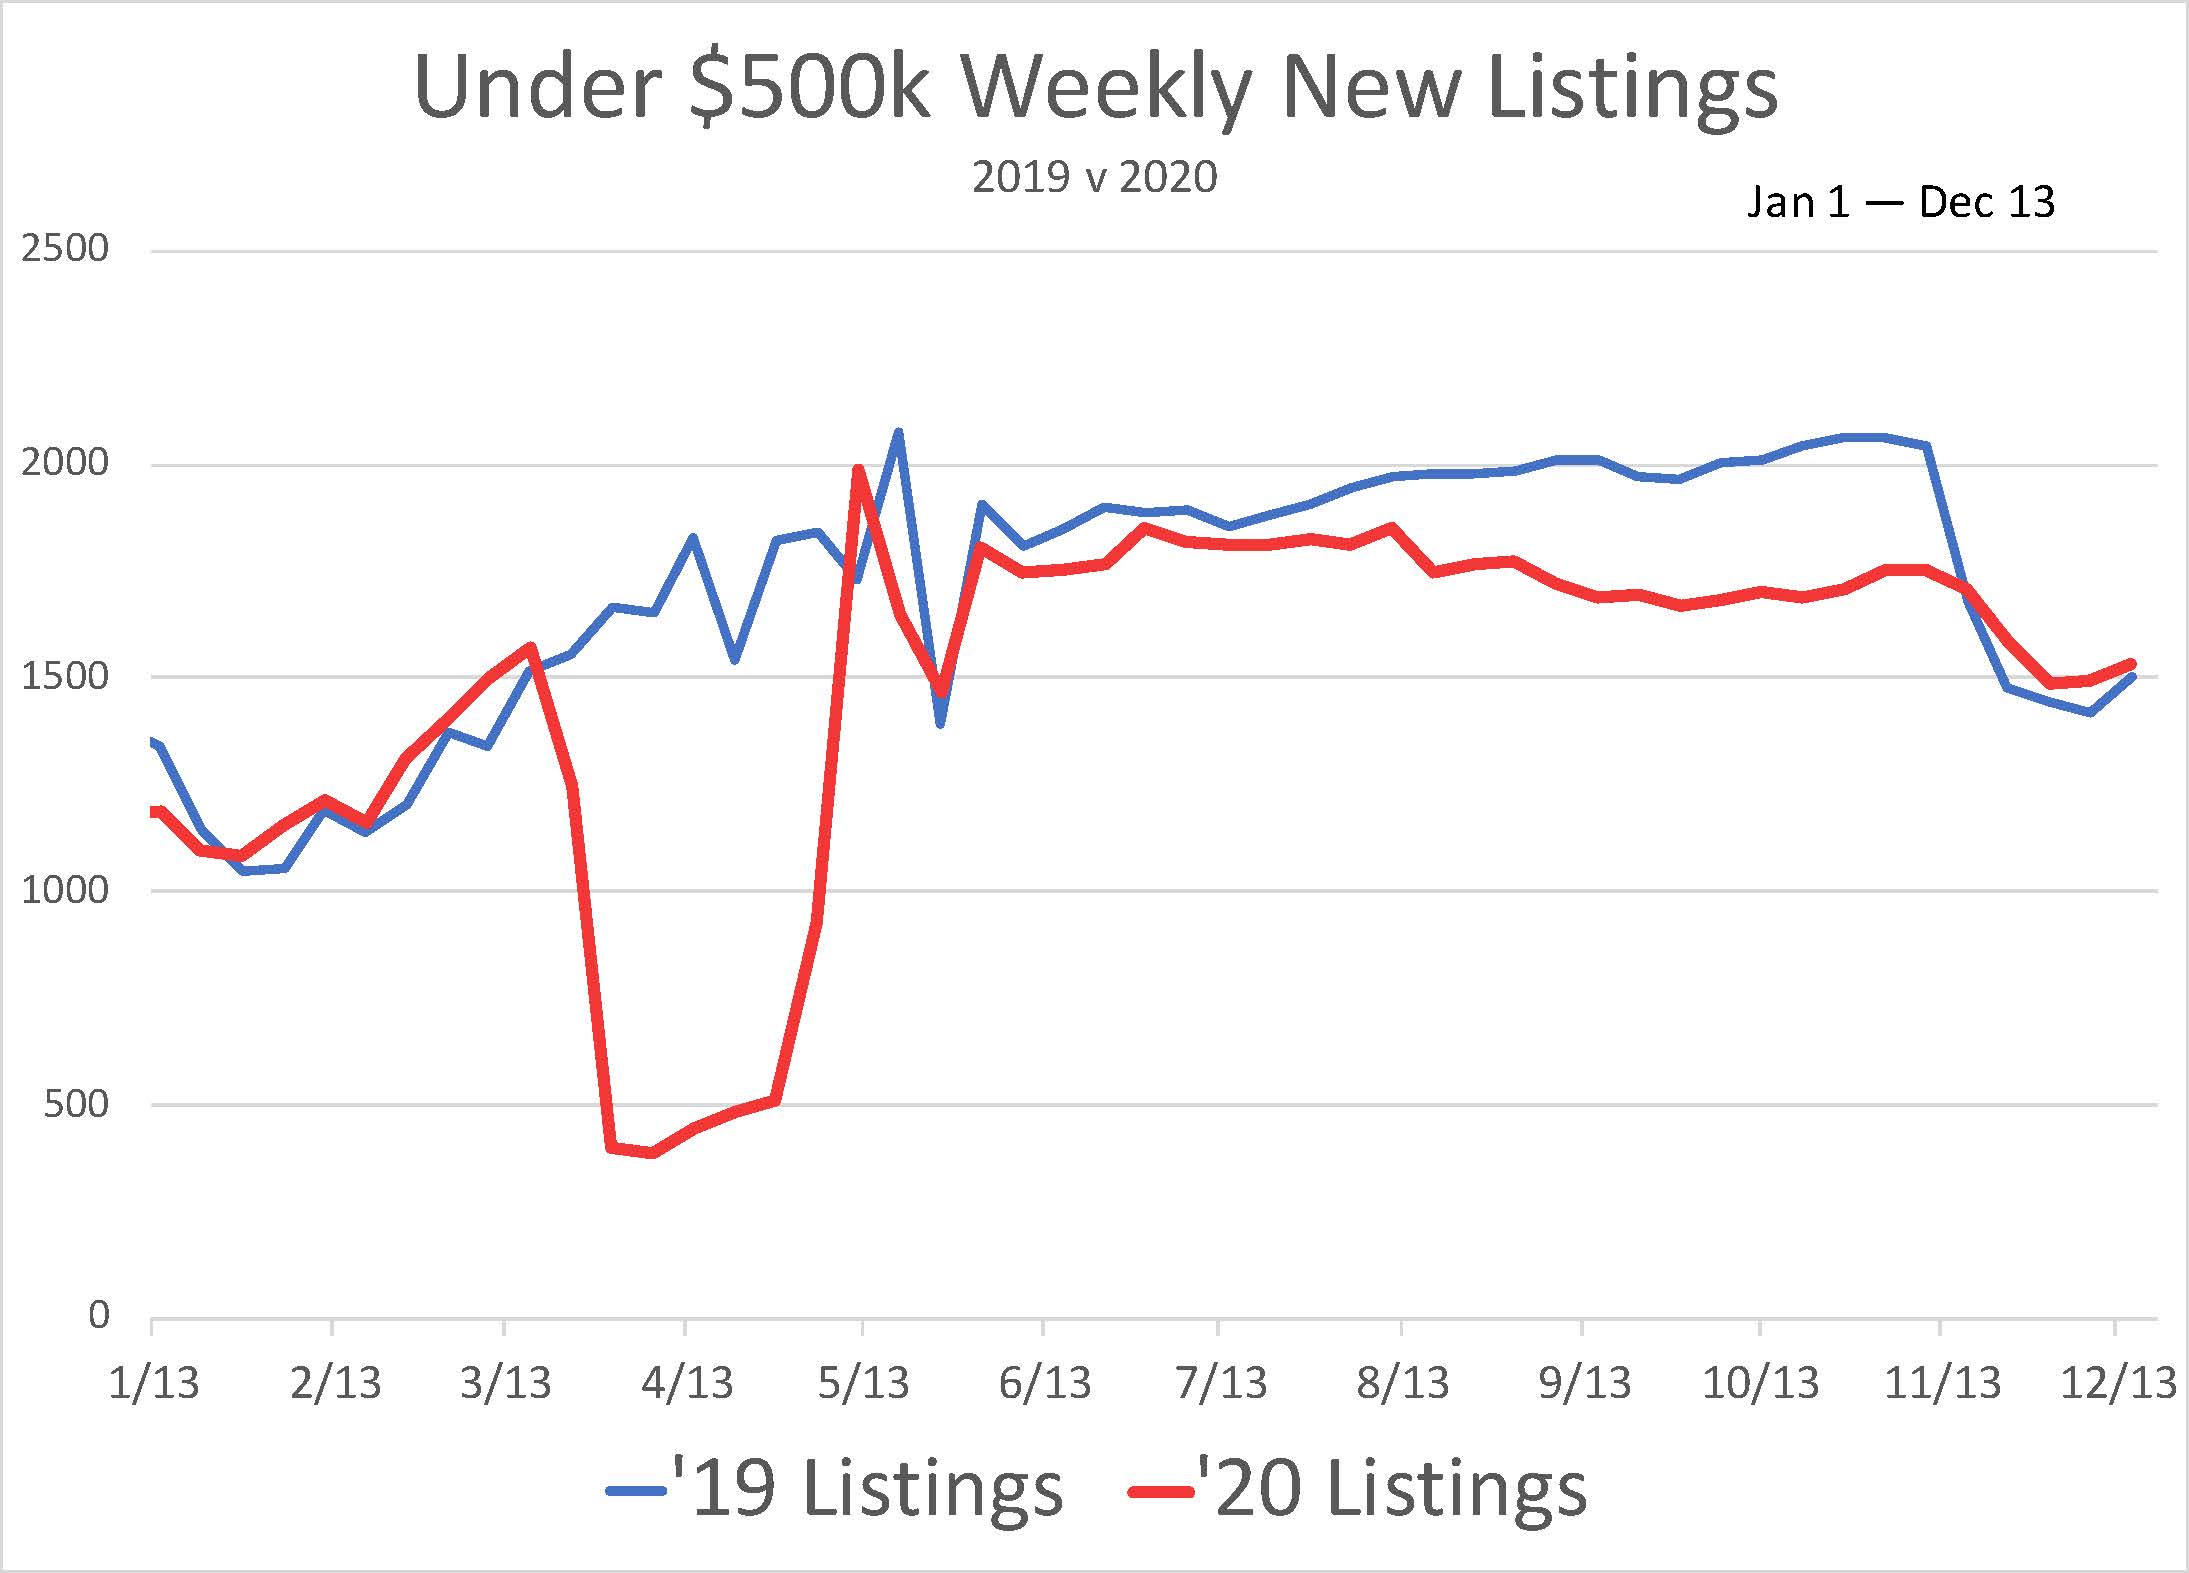
This year’s remarkable demand and strong recovery have been fueled by historic low interest rates and the heightened focus on “home” as a result of Covid lockdowns and temporary closings of work, school and entertainment places people would otherwise be. While many have taken a hard financial hit, others have had a windfall of savings—they weren’t spending anything on travel, dining and lifestyle activities. The charts that follow illustrate market performance through the year. The first two pages focus on the under-$500k market (93% of total SEMI sales). The second two pages focus on the over-$500k luxury SEMI market. The combination of high demand, low rates and Covid has knocked much of the seasonality out of this year’s market. Despite the 55% decline in inventory compared to last December (35% for over-$500k listings), the market continues to roar and so long as inventory holds out, it won’t slow much as it heads into 2021.

• While Covid had little effect on buyer demand, it delayed the arrival of new listings.
• In mid-November the arrival of new listings caught up to last year’s pace because of the holiday drop in mid-November last year. There wasn’t a significant drop this year.
• Covid has minimized seasonality this year. With the current high levels of demand, it’s still a great time for sellers to list.

• Showing activity is a good indicator of demand. Despite this year’s tight inventory, monthly showings have been up 30% since June. That slipped to +18% in November.
• The elevated number of showings continues despite less than half as many available listings, compared to last year.

• Since the markets reopened in May, new pending sales have been outpacing last year’s levels by 35%.
• Despite the two-month market shutdown and inventory levels that are about half of what they were in 2019, under-$500k closed sales will wind up the year about even with last year.

• YTD price per square foot is up 8%, but this chart above adds detail to the story. Notice how stable the red $/SF bars have been since July compared to the blue bars of last year. Typically, price per square foot drops in the fourth quarter when there are fewer prime listings still available.
• With strong demand, tight supply and fewer aging listings hanging around, expect values to hold steady through the next couple of months. Buyers will continue to fight over and pay a premium for move-in-ready homes. Despite the season, it’s still a great time to sell them.

• Since June, upper-end listings have been getting to the market at a similar pace to last year—up a little in early summer, but down in August and September.
• Notice how the blue line dropped in mid-November at the beginning of the holiday season.
• Expect to see less seasonality as the market moves into 2021.

• Over-$500k properties will make up about 7% of this year’s sales—up from 5.6% last year.
• Since the market reopened in May, upper- end new pending sales have been up by 57%.
• While year-end sales typically taper off, over-$500k sales continue to run strong—up 85% in the past month.

• Despite high-end inventory being down 35%, total showings continue to be up 50%—available listings are shown about twice as often as a year ago.
• As Covid has forced people to spend more time in their homes, and homes have become workplaces, expect to see more people looking to upgrade into bigger homes to accommodate both functions.
• Expect unusually high levels of showing activity to continue through the winter. Cabin fever and travel limitations will have more buyers shopping through this winter.

• Although over-$500k sales are up 22%, YTD price per square foot is just even with last year. This chart helps to illustrate the path taken to get there. Values initially dropped with the arrival of the Pandemic in the spring. Values kicked back up and YOY numbers have been up 2% to 4% since September.
• Prices vary by location and condition, but while luxury sales are way up, values will continue to have modest increases.
• Condition is the key to creating value in the upper end market—detail, detail, detail.
Michigan Property Taxes in a Nutshell
2 minutes
Deprecated: preg_split(): Passing null to parameter #2 ($subject) of type string is deprecated in /usr/share/wordpress/blog/reo_blog/wp-includes/formatting.php on line 3506
After several years of rapidly rising prices and mild inflation (until the past two years) homebuyers and sellers need to be aware of the potential for a significant jump between [...]
Southeast Michigan 2024 Housing: Trends and Predictions
2 minutes
Deprecated: preg_split(): Passing null to parameter #2 ($subject) of type string is deprecated in /usr/share/wordpress/blog/reo_blog/wp-includes/formatting.php on line 3506
Through the first half of 2024, expect demand to continue to outweigh supply. However, as the year progresses, expect to see inventory gradually rise into a more balanced position as [...]
’23 Market Summary and ’24 Predictions
< 1 minute
Deprecated: preg_split(): Passing null to parameter #2 ($subject) of type string is deprecated in /usr/share/wordpress/blog/reo_blog/wp-includes/formatting.php on line 3506
After a few years of supply shortages, inventory began to return to more normal levels in the second half of 2023. Demand remains strong and buyers continue to wait for [...]