Blog > Housing Report > Northwest Michigan > Northwest Michigan 7-Year Sale Index
Northwest Michigan 7-Year Sale Index

Topics
- Housing Reports
Subscribe
Get the latest Michigan Housing Reports delivered straight to your inbox!
Topics
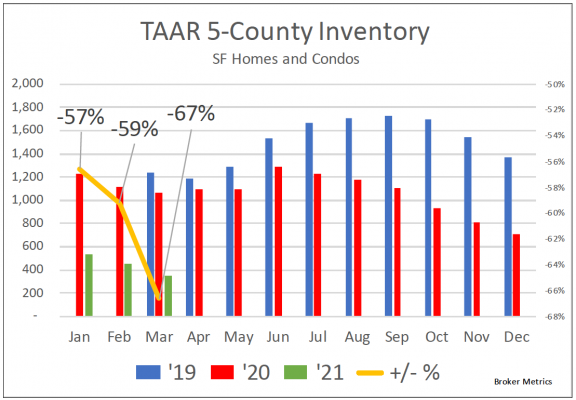
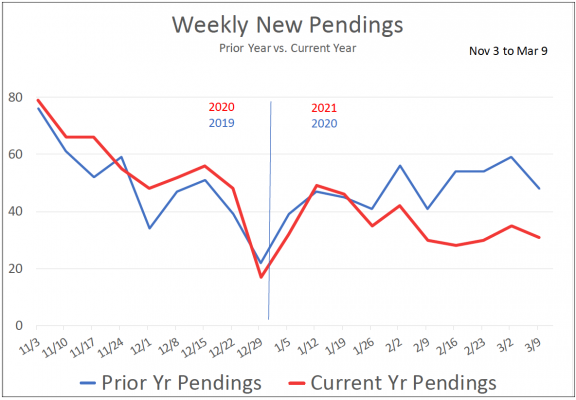
Despite continued strong demand, the 67% YOY decline in inventory is restricting sales and driving up prices. The shortage of available listings is most prevalent in the entry price ranges. Under-$250k YTD sales (through March 9th) are down 23%. Sales in the $250-$500k range are up 15% and price per square foot for those sales rose 18%. Over-$500k sales jumped 56% compared to last year, but values in the upper price ranges have been flat. The slow arrival of new listings is causing a decline in new pendings. Expect inventory shortages to fuel buyer competition and rising prices.
| 2019 | 2020 | 2021 | +/- | |
| YTD Units | 393 | 413 | 400 | -3% |
| YTD Vol (million) | $107.5 | $113.3 | $137.5 | 21% |
| Avg Price | $273,629 | $274,248 | $343,782 | 25% |
| Avg $/SF | $151 | $154 | $186 | 21% |
| Avg SF | 1,812 | 1,777 | 1,845 | 4% |


Michigan Property Taxes in a Nutshell
2 minutes
Deprecated: preg_split(): Passing null to parameter #2 ($subject) of type string is deprecated in /usr/share/wordpress/blog/reo_blog/wp-includes/formatting.php on line 3506
After several years of rapidly rising prices and mild inflation (until the past two years) homebuyers and sellers need to be aware of the potential for a significant jump between [...]
Southeast Michigan 2024 Housing: Trends and Predictions
2 minutes
Deprecated: preg_split(): Passing null to parameter #2 ($subject) of type string is deprecated in /usr/share/wordpress/blog/reo_blog/wp-includes/formatting.php on line 3506
Through the first half of 2024, expect demand to continue to outweigh supply. However, as the year progresses, expect to see inventory gradually rise into a more balanced position as [...]
’23 Market Summary and ’24 Predictions
< 1 minute
Deprecated: preg_split(): Passing null to parameter #2 ($subject) of type string is deprecated in /usr/share/wordpress/blog/reo_blog/wp-includes/formatting.php on line 3506
After a few years of supply shortages, inventory began to return to more normal levels in the second half of 2023. Demand remains strong and buyers continue to wait for [...]